


Next: Advanced example
Up: Basic examples
Previous: Straight line curve fit
I invite you to go to the Basic fitting mode and try to
recover each Basic-1,2,3,4,5 examples and study them. I think
they are self explainatory.
I would like to point to you that if your function can be written as the sum of different functions like in
 |
(1) |
you have the possibility to produce plots where each function  ,
,
 ,... is represented by lines of your choosing. In order to obtain this you write the following
 |
(2) |
as your function and compile it.
Figure 10:
Straight line curve fit with each component shown.
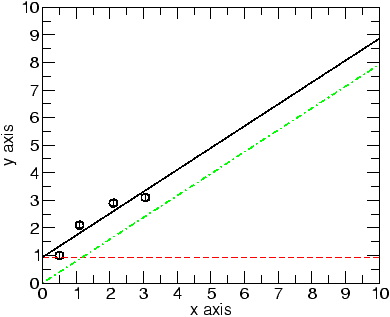 |
Fig. 10 was produced after selecting dashed and
dot dashed curves in red and green colors for the two
components in the plot menu.
Pedro Sebastião
2009-11-16